Location Analysis
Make more informed decisions about your site selections for real estate.
Demographics. .
Authoritative Insights
Location analysis for each address includes:
- 2016 USA Tapestry Segmentation & Demographic
- 2016-2021 USA Population Growth, from U.S. Census Bureau geographies
- 2016 USA Median Household Income, from U.S. Census Bureau geographies
- USA Poverty Ratio, using data from the U.S. Census Bureau
- 2016 USA Population Density
- 2016 USA Crime Index
- U.S. Geological Survey's (USGS) Earthquake Faults
- USA Flood Risk, based upon the original vector data from FEMA's Flood Insurance Rate Map
- plus other data maybe available depending on the site location
Pricing Rate
$11.00
per location
Garofalo Studios is a member of the Esri Partner Network.
Esri is one of the world-wide leaders in geographic information systems.

Inquire about Location Analysis services
Examples
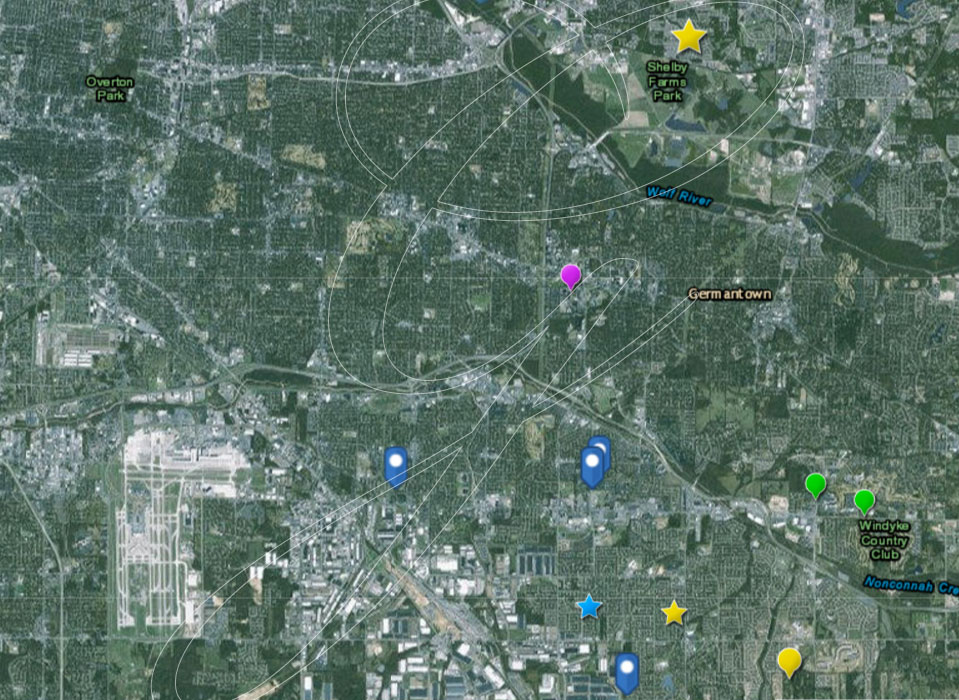
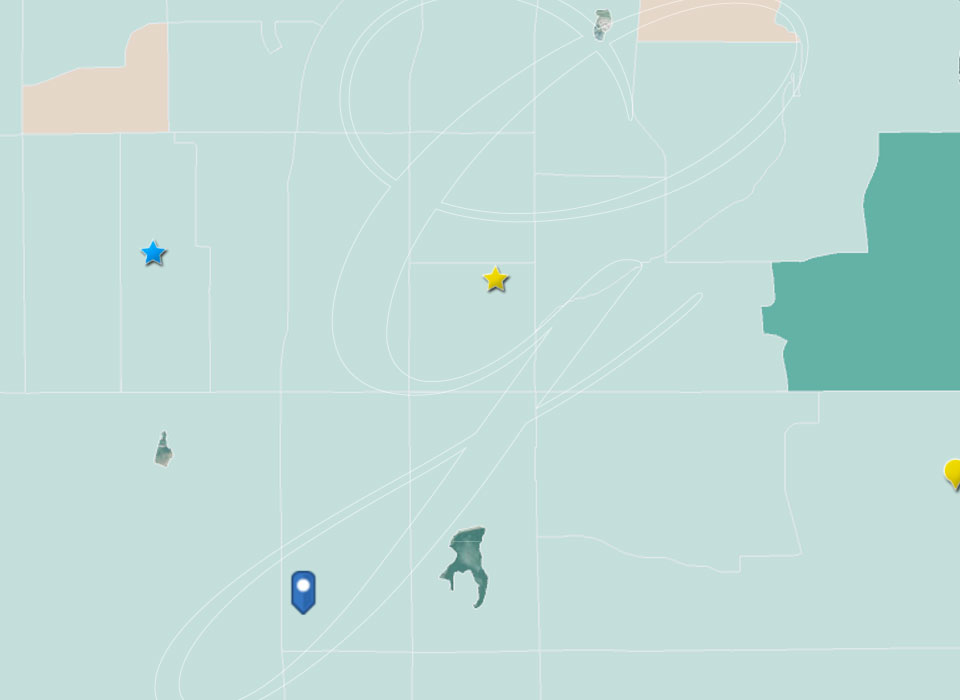
See your multiple locations of interest on a single map.
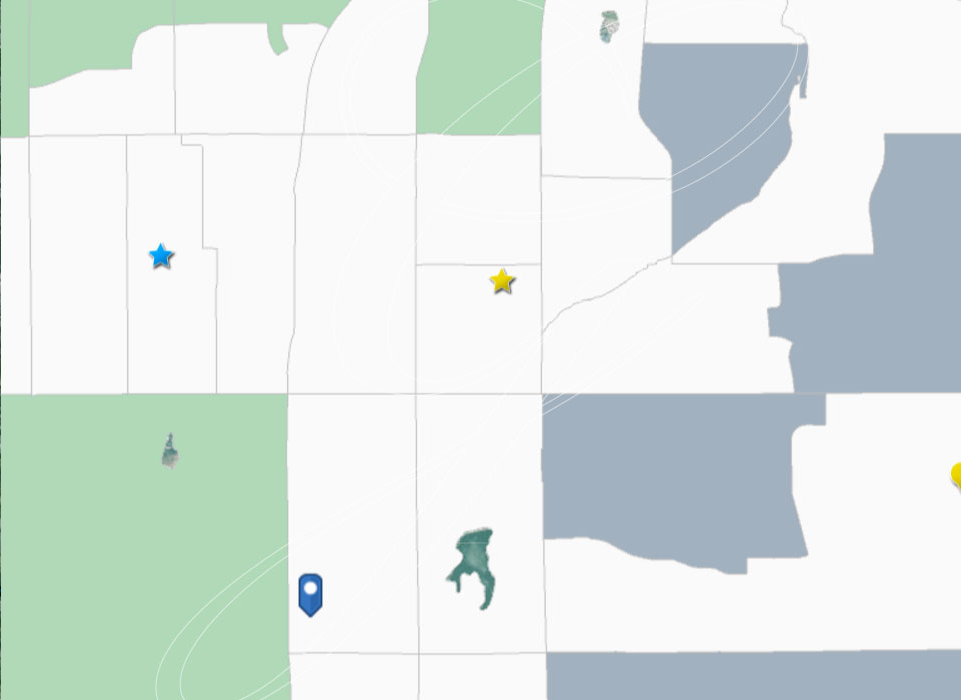
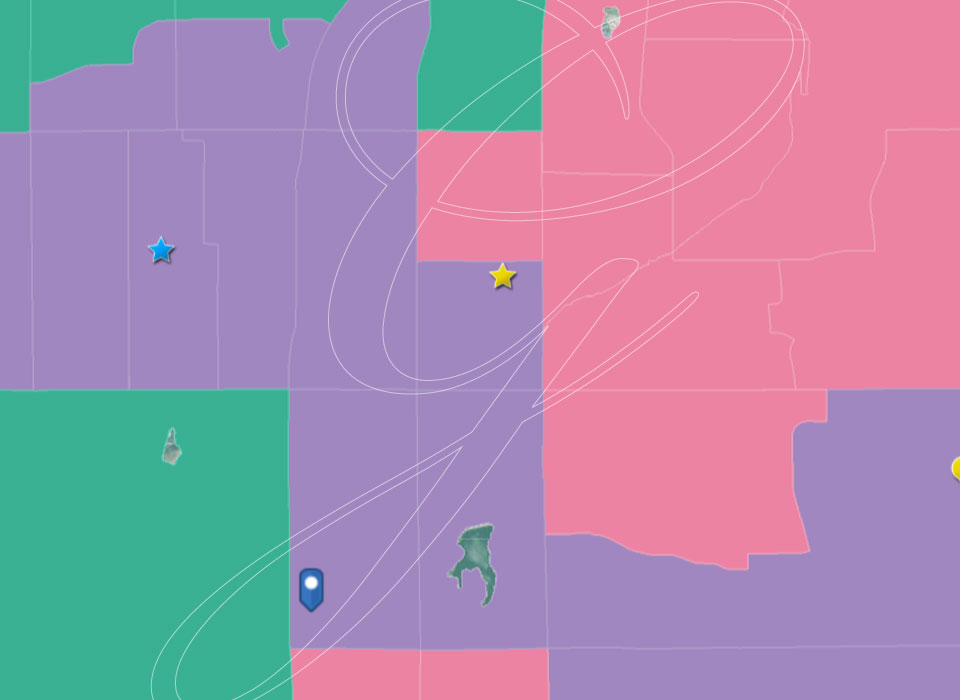
For each of your locations, view the USA Median Household Income.
At the location with the yellow star, the 2016 median household income in the area was $47,647. The 2016 U.S. median household income was $54,149, according to 2016 data from U.S. Census Bureau.
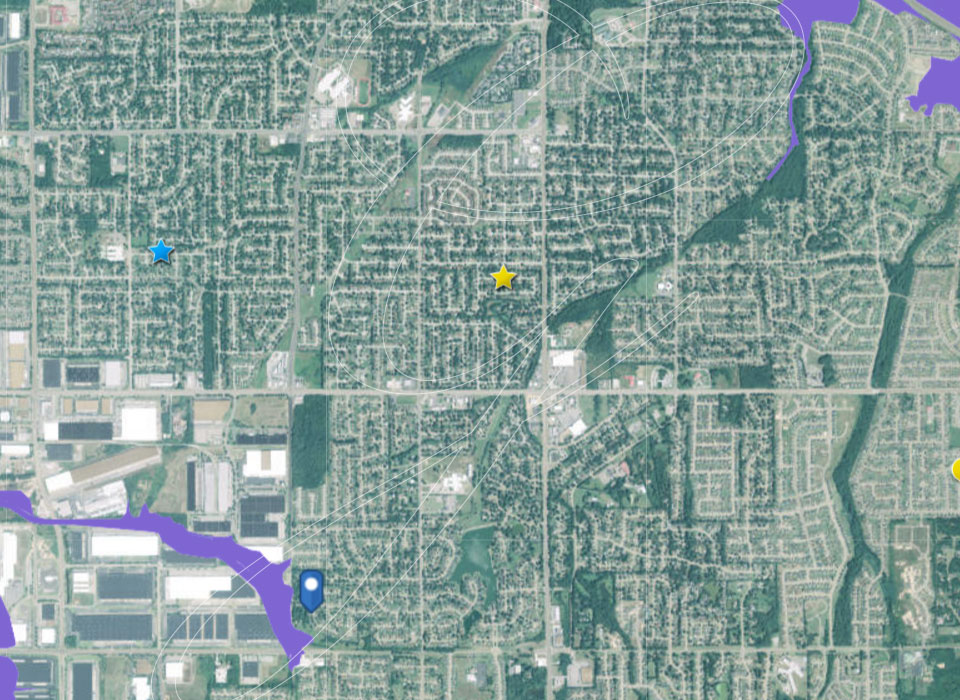
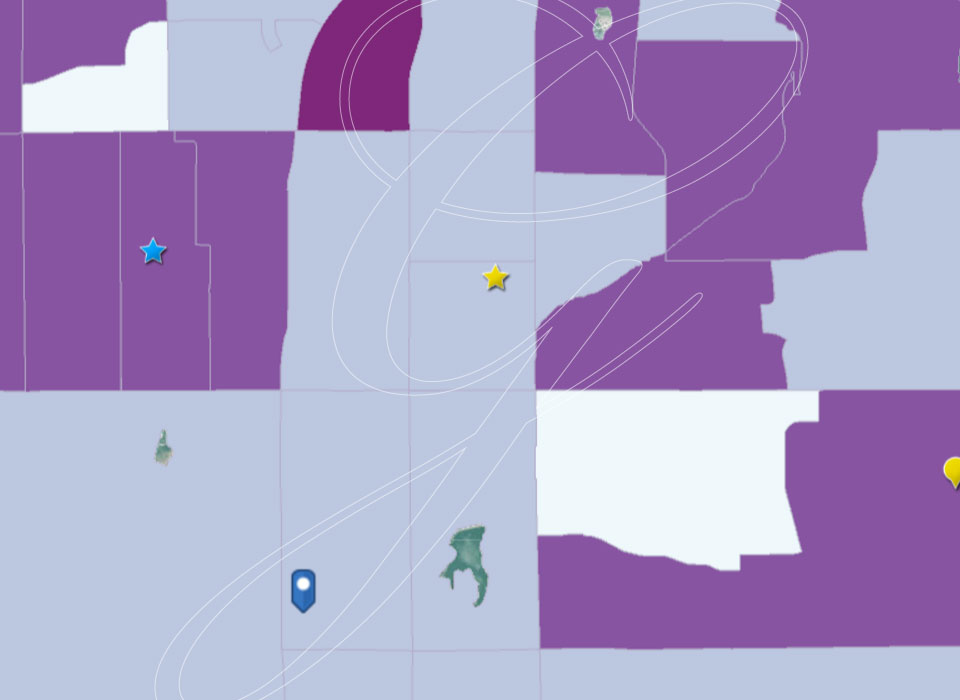
For each of your locations, view the USA Flood Risk (shown in purple).
At the location with the yellow star, the area does not appear to be within a 100-year historical flood risk.
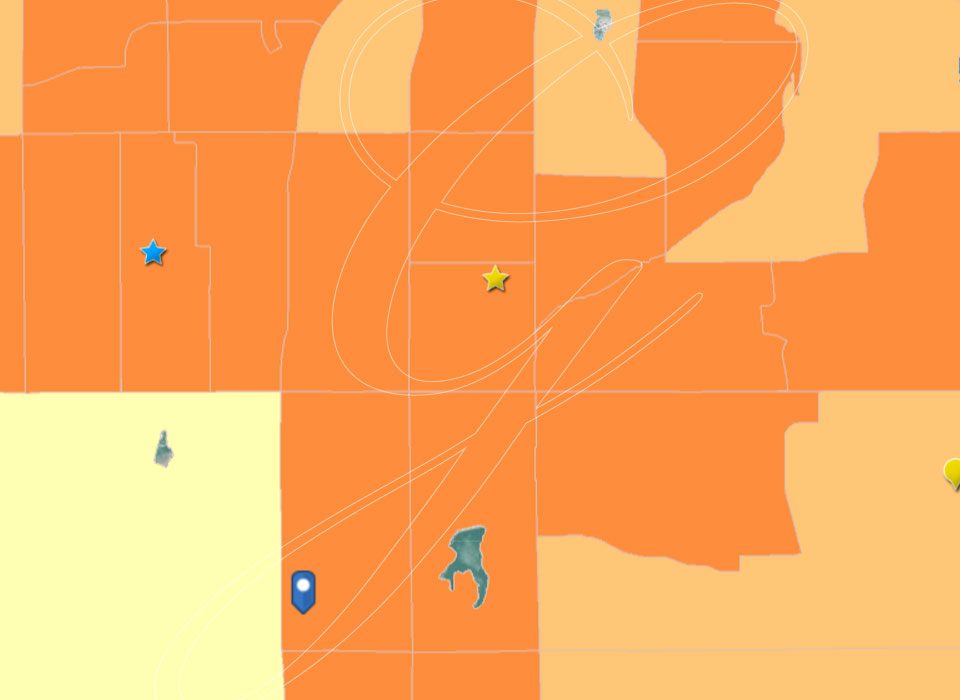
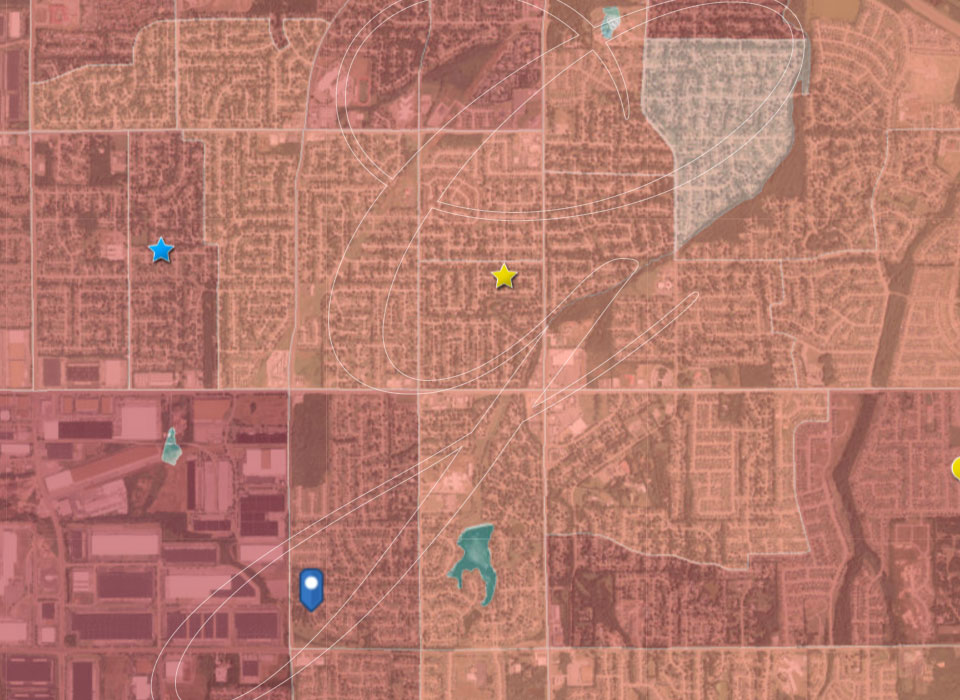
For each of your locations, view the USA Population Density.
At the location with the yellow star, the 2016 population density in the area was 6,217 persons per square mile. In five years, it is estimated to be 6,500 persons per square mile, according to 2016 data from U.S. Census Bureau.
For each of your locations, view the USA Population Density.
At the location with the yellow star, the 2016 dominant demographic segment in the area was "American Dreamers," with an estimated total population of 1,533, a median age of 31, and a median disposable income of $40,374.
For each of your locations, view the USA Population Growth prediction.
At the location with the yellow star, the 2016 population in the area was 1,533 and is estimated to be 1,603 in 2021. The estimated annual rate of change is 0.9%, according to 2016 data from U.S. Census Bureau.
For each of your locations, view the USA Crime Index.
At the location with the yellow star, the 2016 overall crime index in the area is 119, compared to the 2016 U.S. national crime index average of 100.
For each of your locations, view the USA Unemployment Rate.
At the location with the yellow star, the 2016 unemployment rate in the area was 8.4%. The 2016 U.S. national unemployment rate was 5.9%. There are 845 people here over the age of 16 in the work force, according to 2016 data from U.S. Census Bureau.
